Dune Data Accessibility
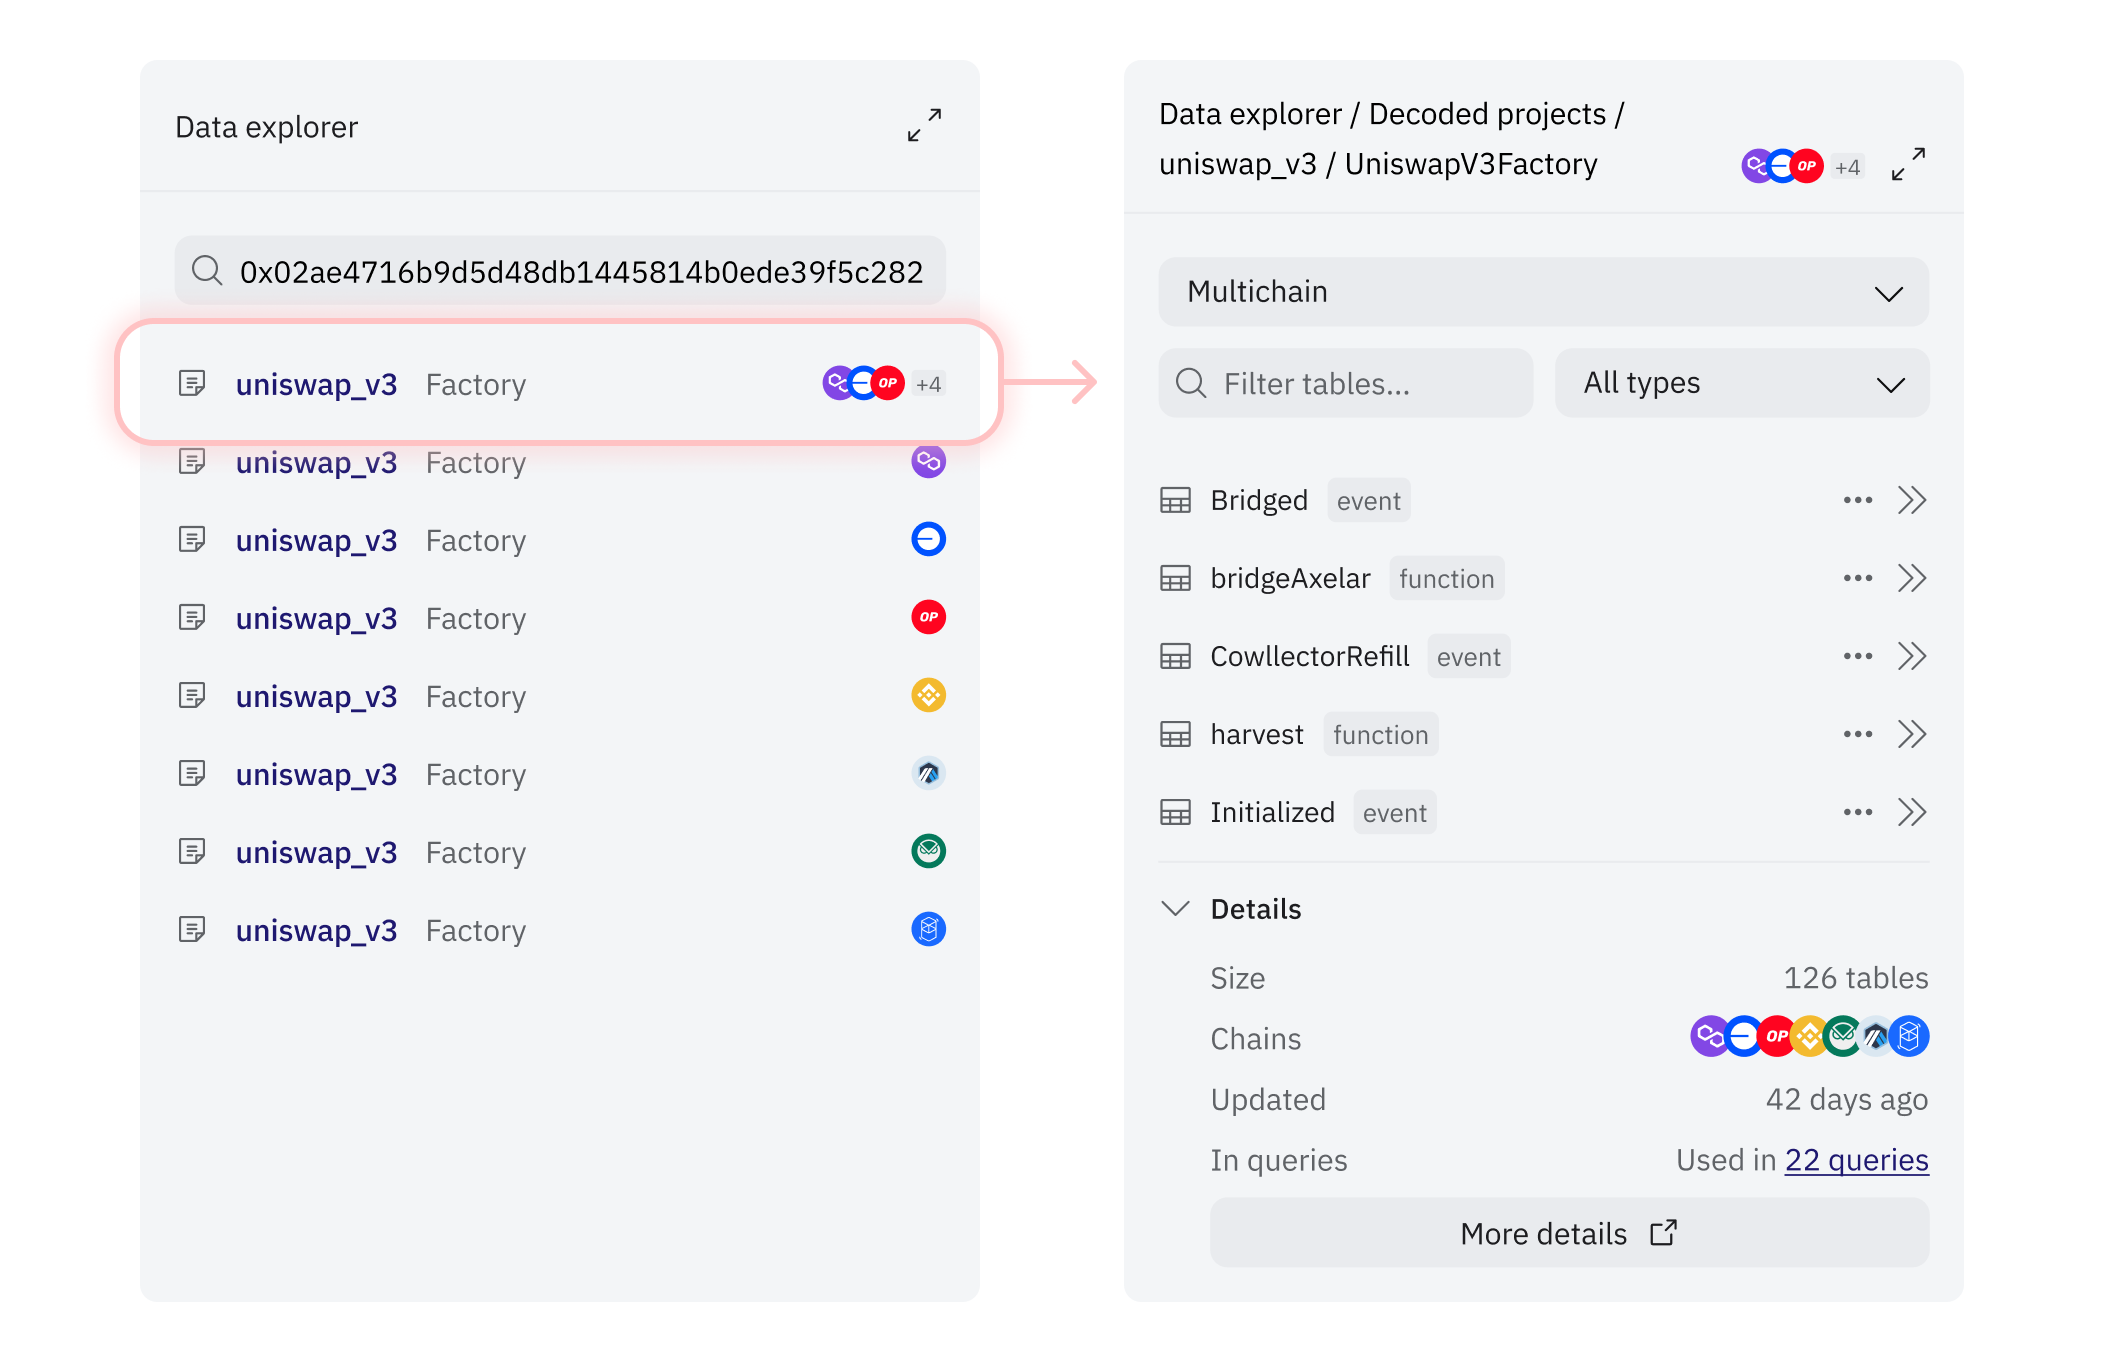
When you query data on Dune, the hardest part usually isn't writing SQL. It's finding the right data. Analysts choose from a catalog of more than 1.6M tables: raw blockchain data, uploads, decoded contracts, old versions of decoded contracts. Search for a major protocol like Uniswap and you'll see hundreds of results, often duplicated across chains. If a contract is deployed across multiple chains, you have to track down each one and stitch the data together yourself. This manual work slows analysts down and creates room for error, especially for anyone new to a protocol.
The data team addressed this by creating multichain contract objects that link and consolidate deployments of the same contract across networks. Instead of querying each chain separately, analysts can reference a single object and know it represents the whole system.
One key choice in the design of the contract page is the structure of the page itself. Rather than leading with raw onchain data, the page starts with actions and community content. When experienced analysts land here, they can see how others have already worked with it: existing queries to learn from, dashboards that illuminate what the data is useful for, or something they can fork and adapt quickly.
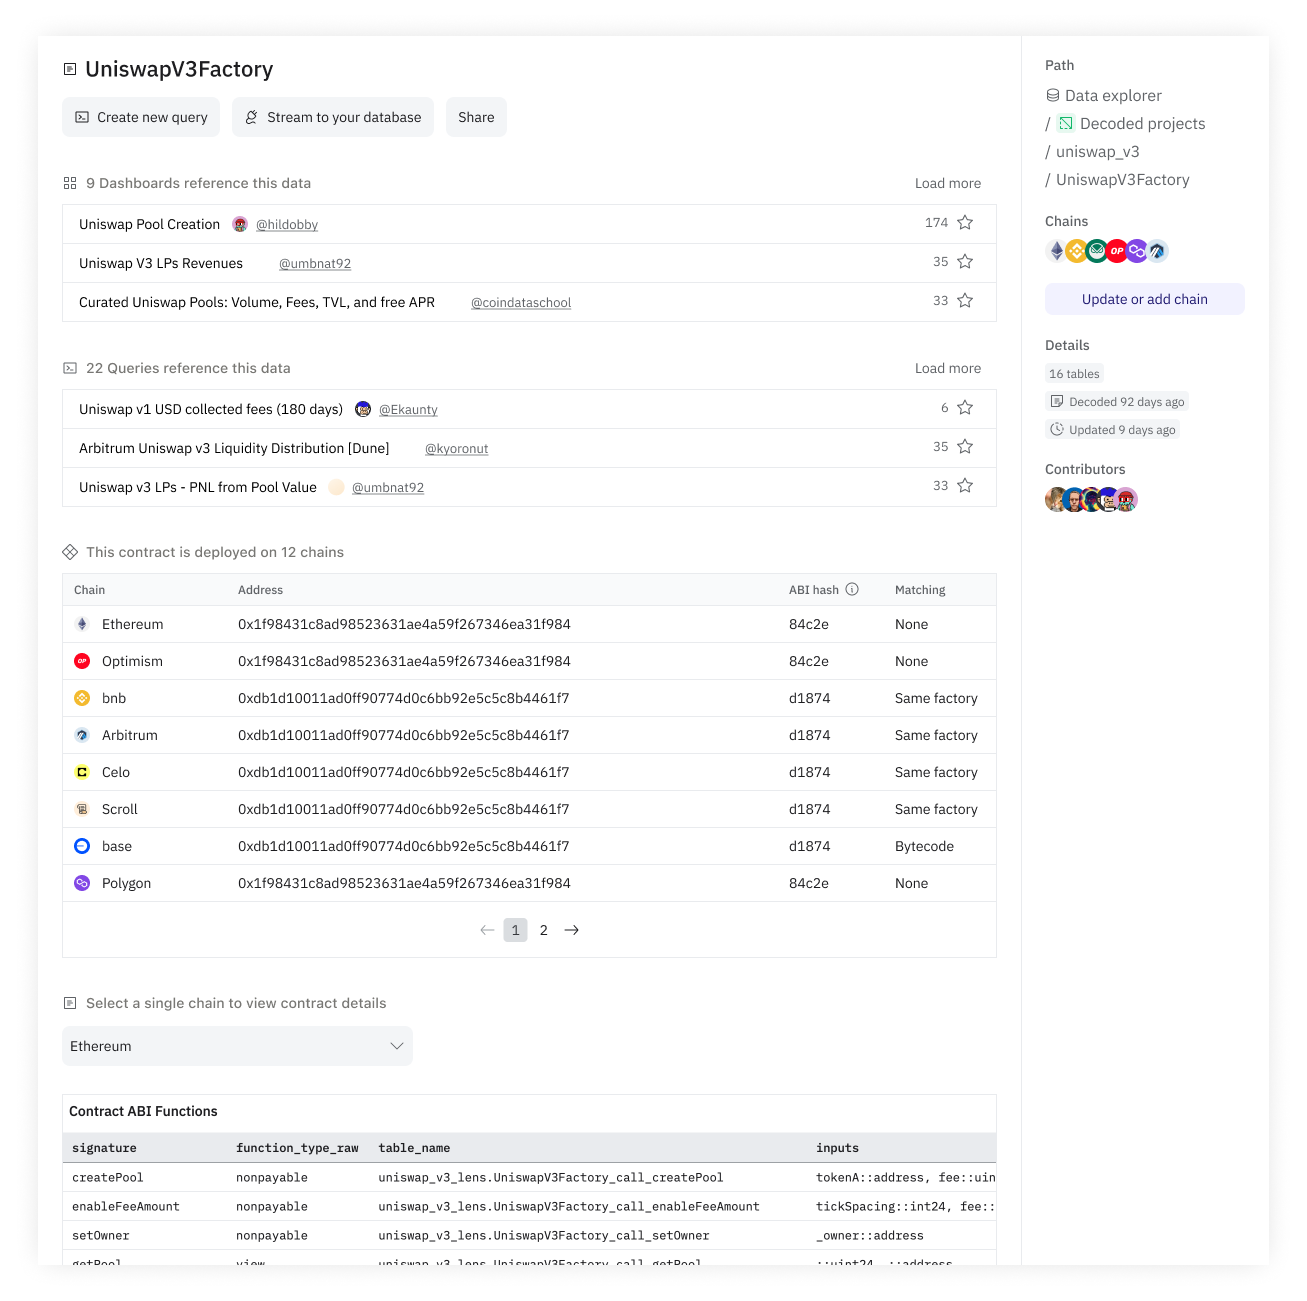
Functions and events still matter, and they're the foundation of the page. But they're framed as reference material, not the entry point. The goal was to help users understand what the contract is for, how people are using it, and where to go next.
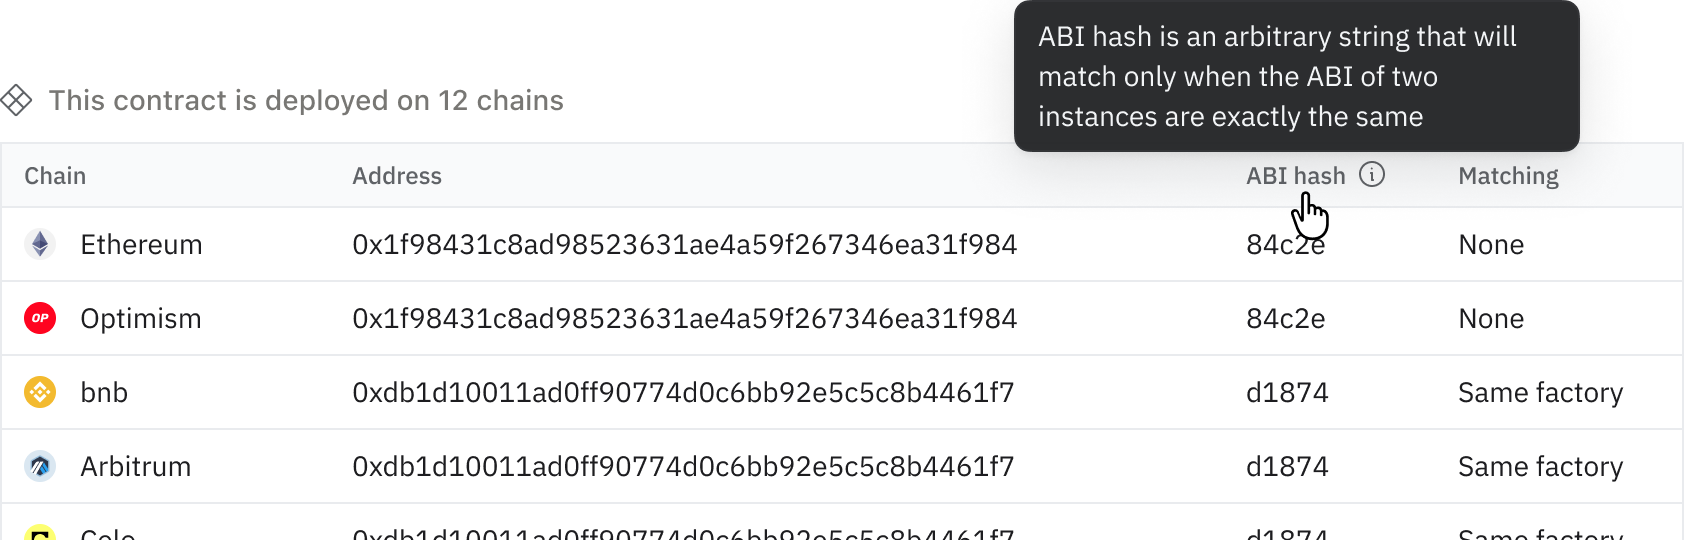
One design puzzle was representing ABI differences across deployments. Some may be identical, some not, and it's important to see at a glance which match and which differ. My solution was to show a short hash of each ABI so that matching is legible immediately.
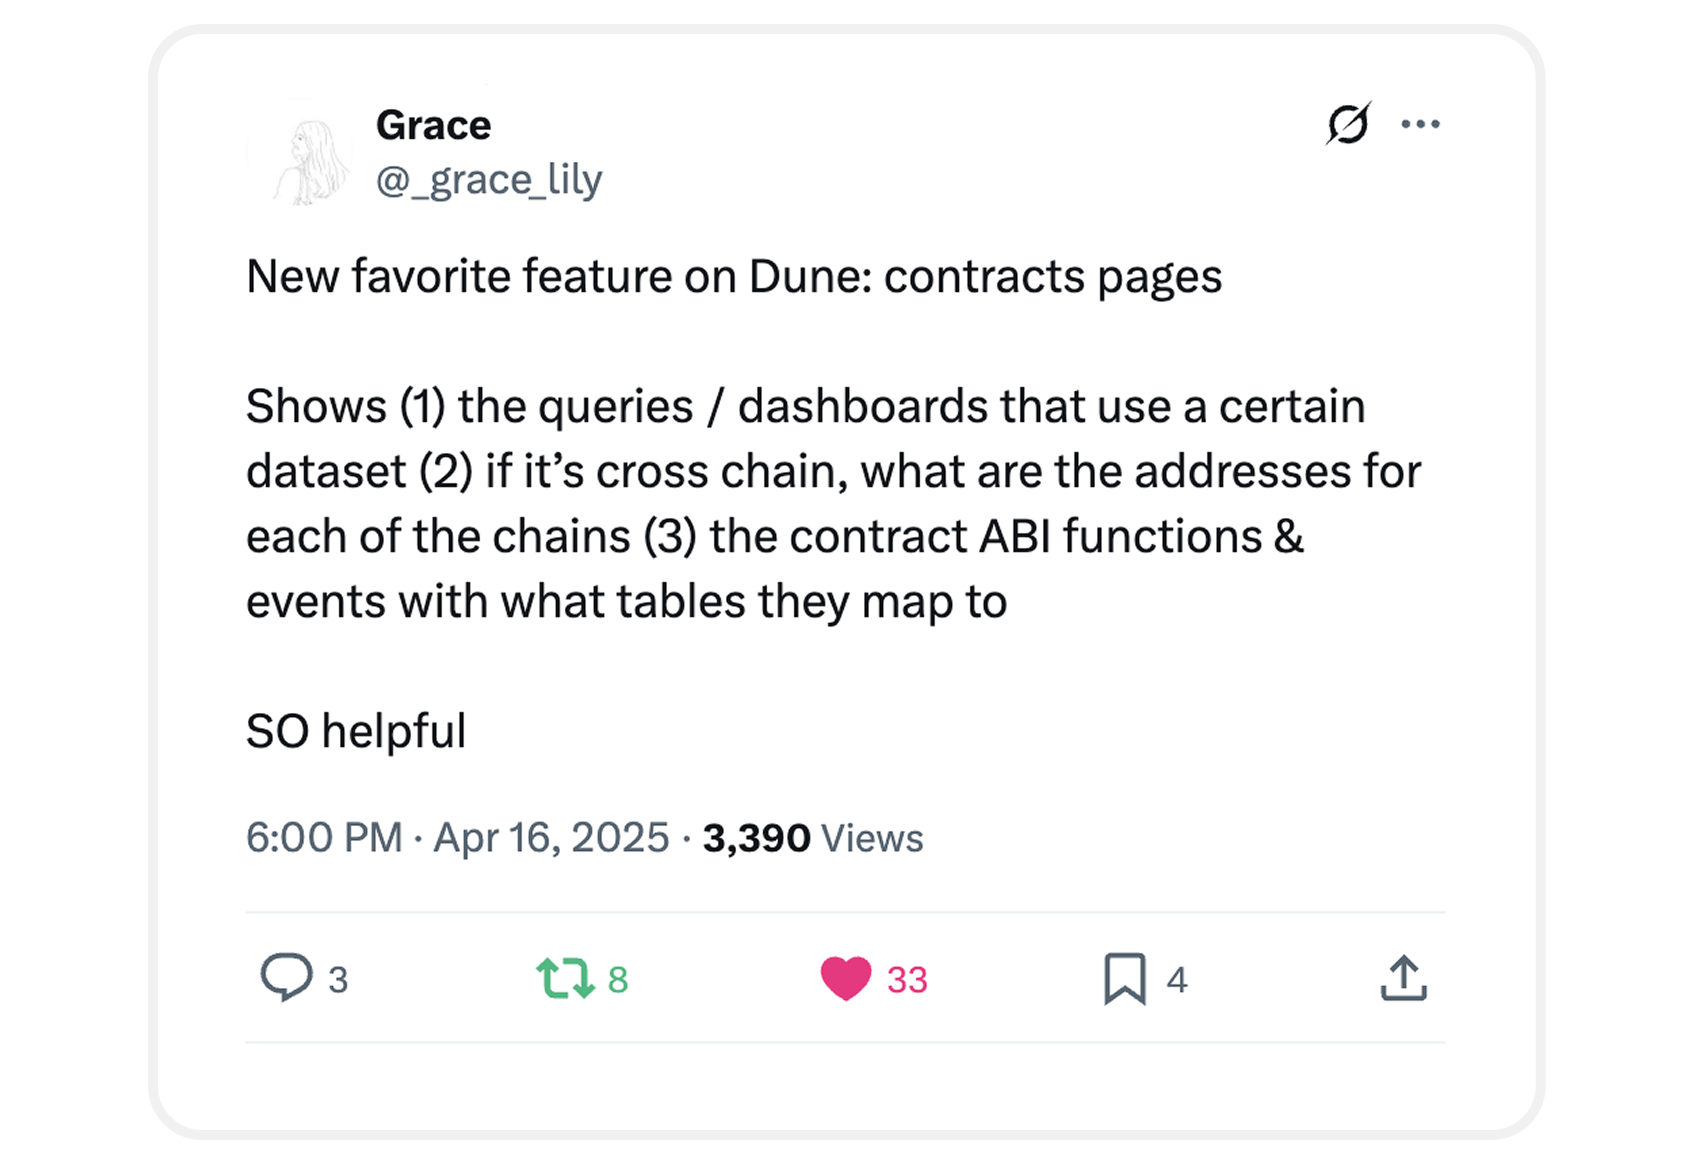
Did it work? Since these were entirely new pages, there was no previous traffic to compare against. The most meaningful signal came from analysts themselves (like the head of data at Uniswap) who said this made their work easier.
Dune's mission is "making onchain data accessible." This project does exactly that: making the raw data more legible, faster to put to work, and making the hard work analysts do a little bit easier.